Financial report 2015/16
At a glance
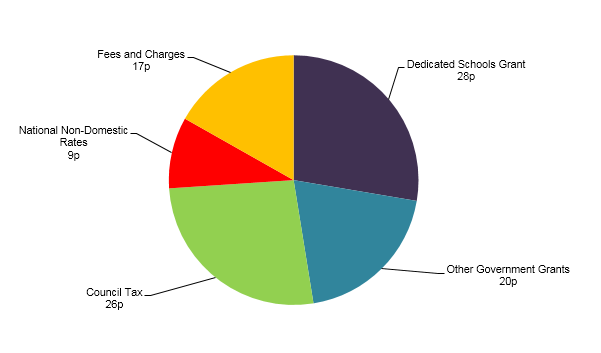
Every £1 we receive to spend on day-to-day services comes from

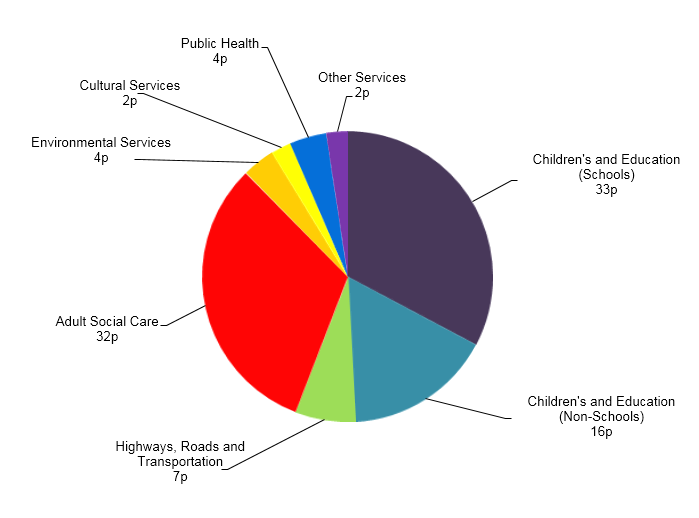
For every £1 we spend on day-today services

Spending and capital investment breakdown
Spending
| Spending | £m |
|---|
| Children's and Education |
552.5 |
| Highways, Roads and Transportation |
75.0 |
| Adult Social Care |
356.7 |
| Public Health |
45.9 |
| Environmental Services |
40.9 |
| Cultural Services |
25.6 |
| Other Services |
26.7 |
| |
1123.3 |
Children's and education
| Children's and education |
£m |
| Secondary Schools |
32.6 |
| Primary Schools |
286.8 |
| Children’s Social Care |
127.1 |
| Special Schools |
23.1 |
| Post 16 |
5.2 |
| Other Education & Community |
52.2 |
| Nursery Schools |
25.5 |
| Total |
552.5 |
Highways
| Highways, roads and transportation |
£m |
| Public Transport |
30.2 |
| Road Maintenance |
29.6 |
| Other Transport/Roads |
9.8 |
| Street Lighting |
2.7 |
| Traffic Management and Road Safety |
2.7 |
| Total |
75 |
Adult social care
| Adult social care |
£m |
| Older People’s Social Care |
118.3 |
| Adults with Physical Disability or Sensory Impairment |
23.6 |
| Adults with Learning Disabilities |
84.1 |
| Adults with Mental Health Needs |
9.5 |
| Other social care |
121.2 |
| Total |
356.7 |
Environmental services
| Environmental services |
£m |
| Waste Disposal |
32.8 |
| Community Safety |
4.2 |
| Trading Standards |
3.9 |
| Total |
40.9 |
Cultural services
| Cultural services |
£m |
| Library Service |
17.1 |
| Country Parks, Sport and Arts |
7.0 |
| Archives |
1.5 |
| Total |
25.6 |
Public health
| Public health |
£m |
| Sexual Health |
7.2 |
| Obesity |
1.3 |
| Substance Misuse |
12.5 |
| Smoking & Tabacco |
1.7 |
| Children 5-19 |
16.4 |
| Other |
6.8 |
| Total |
45.9 |
Other services
| Other services |
£m |
| Corporate and Democratic Core |
9.6 |
| Planning & Development |
11.6 |
| Other Services |
5.4 |
| Non Distributed Costs |
0.1 |
| Total |
26.7 |
Funding
| Funding |
£m |
| Council Tax |
298.7 |
| Dedicated Schools Grant |
312.0 |
| National Non-Domestic Rates |
104.2 |
| New Homes Bonus Scheme |
3.3 |
| Education Services Grant |
7.1 |
| Capital Grants and Contributions |
43.7 |
| Other Government Grants |
212.8 |
| Use of General Fund Balances |
3.0 |
| Total Funding |
984.8 |
Capital investment
| Capital investment 2015/16 |
£m |
| Children & Young People |
25.5 |
| Culture & Regenration |
0.9 |
| Adult Social Care & Health |
0.1 |
| Support services & trading operations |
44.4 |
| Total |
70.9 |
Balance sheet
This is a statement of our financial position at the end of the financial year. It is a summary of our assets and of our liabilities. During 2015/16 our total net assets increased by £225m mainly due to Pension Liability and property valuation gains
Net assets
| Net assets |
2014/15 |
2015/16 |
| Property, plant & equipment |
1185.2 |
1254.2 |
| Other long term assets |
31.3 |
34.2 |
| Short term investments |
20.0 |
30.0 |
| Debtors |
75.7 |
65.4 |
| Other short term assets |
45.2 |
67.5 |
| |
1357.4 |
1451.3 |
| Less |
|
|
| Short term borrowings |
-22.8 |
-24.1 |
| Short term creditors and provisions |
-111.3 |
-100.8 |
| Long term borrowings |
-398.8 |
-428.5 |
| Other long term liabilities |
-142.4 |
-143.9 |
| Pensions Liability |
-1087.7 |
-934.5 |
| |
-1763.0 |
-1631.8 |
| |
|
|
| Total net assets |
-405.6 |
-180.5 |
Funded by
| Funded by |
2014/15 |
2015/16 |
| Earmarked reserves |
170.8 |
171 |
| General reserves |
27.0 |
24.0 |
| Capital accounting and other unusable reserves |
484.3 |
558.9 |
| |
682.1 |
753.9 |
| Less Pensions reserve |
-1087.7 |
-934.5 |
| |
-405.6 |
-180.6 |
Terms
- earmarked reserves are amounts set aside for specific purposes. They include amounts set aside for future capital investment and any unspent budgets held by schools
- general reserves are amounts we have set aside to cover unplanned or unexpected spending demands in the future. While we we need to keep enough aside to maintain a secure financial position we keep these amounts as low as possible so that we can spend more on delivering services while minimising the call on the council tax payer
- capital accounting and other unusable reserves are amounts held under accounting regulations and are not available for spending by the council
- pensions reserves represent the liability to the council has to fund pensions earned by past and present employees.


